この記事では、Twitterのツイートを用いて感情分析を行っていきます。初めに、感情分析について紹介し、使用するデータセットの概要、データ処理とモデルの実装、過学習対策とモデルの評価、考察の順に紹介していきます。最後に今後の課題を述べたいと思います。
感情分析について
感情分析は人の顔や音声、テキストからポジティブ、ネガティブなどといった様々な感情を推測することができます。また、感情分析は主にルールベースの手法と機械学習を用いた手法があります。今回は、後者の方法でテキストから感情を推測するモデルを実装していきます。実装にはTensorFlowを使用していきます。
データセットの概要
今回は、Kaggleで提供されているTwitterのデータセットを使用していきます。データセットの概要は以下の通りです。
- データ数:160万
- ラベルの種類:2(ポジティブ、ネガティブ)
- カテゴリー数:6(ツイートのID、ツイートした日付、クエリ、ツイートしたユーザー名、ツイート)
データ処理とモデルの実装
処理の流れは以下の通りです。
- データの確認を行う。
- 使用するデータを抽出する。
- 学習、検証、テストデータに分割する。
- テキストを数値に変換し、テキストの長さを統一する。
- ラベルをNumpy配列に変換する。
- モデルの構築と学習を行う。
- モデルの学習プロセスをplotする。
データ処理
まずは、使用するライブラリをimportします。
|
1 2 3 4 5 6 7 8 9 10 11 12 13 |
import tensorflow as tf import pandas as pd import numpy as np import matplotlib.pyplot as plt import nltk import seaborn as sns import collections from sklearn.model_selection import train_test_split from tensorflow.keras.preprocessing.text import Tokenizer from tensorflow.keras.preprocessing.sequence import pad_sequences from nltk.corpus import stopwords from nltk.stem import SnowballStemmer from sklearn.metrics import confusion_matrix |
データの確認をしていきます。
|
1 2 |
df = pd.read_csv("./training_cleaned.csv", header=None) df.head() |

各カテゴリは左からラベル、ツイートのID、ツイートした日付、クエリ、ツイートしたユーザー名、ツイートです。
次に、データセットのラベルの列とツイートの列を抽出し、データの概要を確認します。以降では、ツイートをテキストと表記します。
|
1 2 |
corpus = df[[0, 5]] corpus.info() |
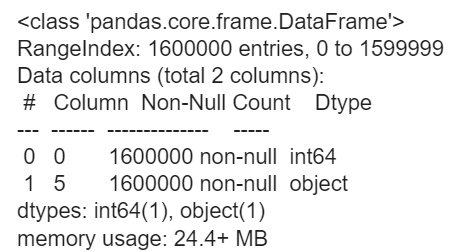
データ数は160万、ラベルはint型で、テキストはstr型であることが確認できます。また、欠損値がないこともわかります。
次は、ラベルとテキストをそれぞれ抽出し、listに格納していきます。また、ラベル0がネガティブ、ラベル1がポジティブになるようラベルを修正します。
|
1 2 3 4 5 6 7 8 9 10 |
sentences = [] labels = [] for l, s in zip(corpus[0], corpus[5]): sentences.append(s) if l == 4: l = 1 labels.append(l) else: labels.append(l) |
次は学習、検証、テストデータに分割していきます。それぞれのデータ数の確認も行います。
|
1 2 3 4 5 6 |
x_train_full, x_test, y_train_full, y_test = train_test_split(sentences, labels, test_size=0.1, random_state=3407) x_train, x_valid, y_train, y_valid = train_test_split(x_train_full, y_train_full, test_size=0.2, random_state=3407) print(f"train_data_size : {len(x_train)}") print(f"valid_data_size : {len(x_valid)}") print(f"test_data_size : {len(x_test)}") |

学習を行うには、入力となるテキストを数値に変換する必要があります。また、テキストの長さを統一する必要もあります。ここではテキスト中の単語にIDを振り分け、テキストの長さを統一する処理を行っています。
|
1 2 3 4 5 6 7 8 9 10 11 12 13 |
oov_tok = "<OOV>" padding_type="post" max_length=16 tokenizer = Tokenizer(oov_token=oov_tok) tokenizer.fit_on_texts(x_train) word_index = tokenizer.word_index train_sequences = tokenizer.texts_to_sequences(x_train) train_padded = pad_sequences(train_sequences, padding=padding_type, maxlen=max_length) print(f"tokenの種類:{len(word_index)}") print(f"パディング前のシーケンスの長さ:{len(train_sequences[0])}") print(f"パディング後のシーケンスの長さ:{len(train_padded[0])}") |

Tokenizerインスタンスを使用することでテキスト中の単語にIDを振り分けることができます。tokenizer.fit_on_texts()にテキストを渡し、テキストを単語に分割して出現頻度の多い単語から順にIDを振り分けます。tokenizer.word_indexによって単語と単語IDがマッピングされた単語ID辞書を参照することができます。次に、tokenizer.texts_to_sequences()によって単語ID辞書をもとにテキスト中の単語をIDに変換します。最後は、pad_sequences()によって、テキストの長さを統一します。また、pad_sequences()によってlistをNumpy配列に変換してくれます。
学習データをもとに作成した単語ID辞書を用いて検証、テストデータの前処理を行っていきます。また、学習データと同じテキストの長さに統一する必要があります。
|
1 2 3 4 5 |
valid_sequences = tokenizer.texts_to_sequences(x_valid) valid_padded = pad_sequences(valid_sequences, padding=padding_type, maxlen=max_length) test_sequences = tokenizer.texts_to_sequences(x_test) test_padded = pad_sequences(test_sequences, padding=padding_type, maxlen=max_length) |
次は学習、検証、テストデータのラベルをlistからNumpy配列に変換します。
|
1 2 3 |
y_train = np.array(y_train) y_valid = np.array(y_valid) y_test = np.array(y_test) |
モデルの実装
次はモデルを構築して、学習を行っていきます。今回はEmbeddingレイヤ、Denseレイヤのみで構成されたシンプルなモデルを実装します。ここで実装するモデルをベースモデルとします。
|
1 2 3 4 5 6 7 8 9 10 11 12 13 14 15 16 17 |
#Setting vocab_size = len(word_index) + 1 embedding_dim = 16 model = tf.keras.models.Sequential([ tf.keras.layers.Embedding(vocab_size, embedding_dim, input_length=max_length), tf.keras.layers.Flatten(), tf.keras.layers.Dense(256, activation="relu"), tf.keras.layers.Dense(64, activation="relu"), tf.keras.layers.Dense(1, activation="sigmoid") ]) model.compile(loss="binary_crossentropy", optimizer="adam", metrics=["accuracy"]) model.summary() num_epochs = 5 num_batchs = 100 history = model.fit(train_padded, y_train, epochs=num_epochs, batch_size=num_batchs, validation_data=(valid_padded, y_valid)) |
学習結果をplotします。
|
1 2 3 4 5 6 7 8 9 10 11 12 13 14 15 16 17 18 19 20 21 |
acc=history.history["accuracy"] val_acc=history.history["val_accuracy"] loss=history.history["loss"] val_loss=history.history["val_loss"] epochs=range(len(acc)) plt.plot(epochs, acc, "r") plt.plot(epochs, val_acc, "b") plt.title("Training and validation accuracy") plt.xlabel("Epochs") plt.ylabel("Accuracy") plt.legend(["Accuracy", "Validation Accuracy"]) plt.show() plt.plot(epochs, loss, "r") plt.plot(epochs, val_loss, "b") plt.title("Training and validation loss") plt.xlabel("Epochs") plt.ylabel("Loss") plt.legend(["Loss", "Validation Loss"]) plt.show() |
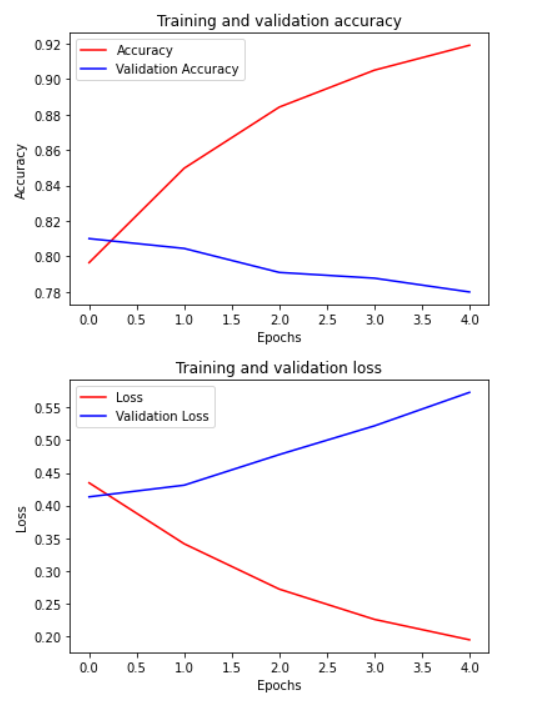
上の図が学習、検証データのAccuracyになります。下の図は両データのLossになります。横軸はともに学習回数を表しています。Accuracyを確認すると学習データは92%を超えていますが、検証データは約78%であることからモデルは過学習していることが分かります。また、Lossについては学習回数に伴い検証データのLossが大きく上昇しています。
次はテストデータを用いてモデルの評価を行います。
|
1 |
model.evaluate(test_padded, y_test) |

テストデータのAccuracyは78.1%、Lossは56.8%であることが確認できました。次は、モデルの過学習の改善とモデルの評価を行っていきます。
過学習対策とモデルの評価
過学習対策
上記で実装したベースモデルは、過学習をしていました。そこで、各レイヤのニューロン数を削減し、Dropoutレイヤを追加することで過学習を改善したいと思います。
|
1 2 3 4 5 6 7 8 9 10 11 12 13 14 15 16 17 18 |
#Setting vocab_size = len(word_index) + 1 embedding_dim = 16 model2 = tf.keras.models.Sequential([ tf.keras.layers.Embedding(vocab_size, embedding_dim, input_length=max_length), tf.keras.layers.Dropout(0.2), tf.keras.layers.Flatten(), tf.keras.layers.Dense(64, activation="relu"), tf.keras.layers.Dense(32, activation="relu"), tf.keras.layers.Dense(1, activation="sigmoid") ]) model2.compile(loss="binary_crossentropy", optimizer="adam", metrics=["accuracy"]) model2.summary() num_epochs = 5 num_batchs = 100 history2 = model2.fit(train_padded, y_train, epochs=num_epochs, batch_size=num_batchs, validation_data=(valid_padded, y_valid)) |
ベースモデルと比較します。
|
1 2 3 4 5 6 7 8 9 10 11 12 13 14 15 16 17 18 19 20 21 22 23 24 25 26 27 28 29 30 31 32 33 34 35 36 37 38 39 40 41 42 |
acc=history.history["accuracy"] val_acc=history.history["val_accuracy"] loss=history.history["loss"] val_loss=history.history["val_loss"] new_acc=history2.history["accuracy"] new_val_acc=history2.history["val_accuracy"] new_loss=history2.history["loss"] new_val_loss=history2.history["val_loss"] epochs=range(len(acc)) epochs2=range(len(new_acc)) #epochs2=range(7) def acc_plot(epochs, epochs2, acc, val_acc, new_acc, new_val_acc): plt.plot(epochs, acc, "r") plt.plot(epochs, val_acc, "b") plt.plot(epochs2, new_acc, "m") plt.plot(epochs2, new_val_acc, "c") plt.title("Training and validation accuracy") plt.xlabel("Epochs") plt.ylabel("Accuracy") plt.legend(["Acc", "Valid_Acc", "New_Acc", "New_Val_Acc"]) plt.show() def loss_plot(epochs, epochs2, loss, val_loss, new_loss, new_val_loss): plt.plot(epochs, loss, "r") plt.plot(epochs, val_loss, "b") plt.plot(epochs2, new_loss, "m") plt.plot(epochs2, new_val_loss, "c") plt.title("Training and validation loss") plt.xlabel("Epochs") plt.ylabel("Loss") plt.legend(["Loss", "Validation Loss", "New_Loss", "New_Val_Loss"]) plt.show() acc_plot(epochs, epochs2, acc, val_acc, new_acc, new_val_acc) loss_plot(epochs, epochs2, loss, val_loss, new_loss, new_val_loss) |
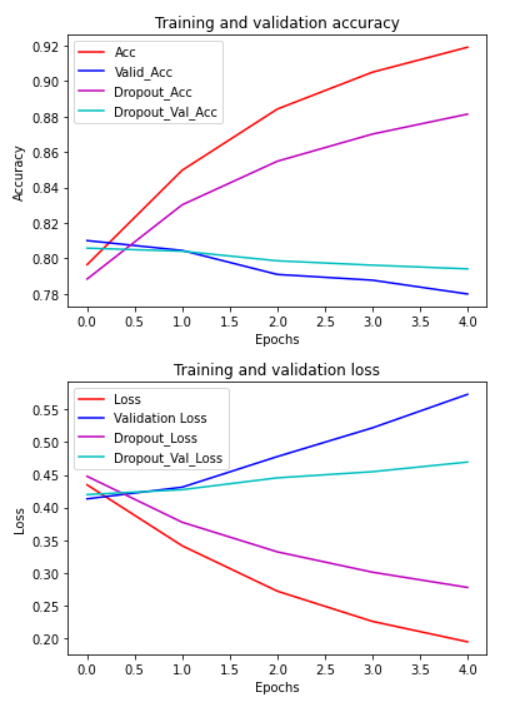
前回の図に紫色、シアン色のplotを追加しています。紫色、シアン色のplotはそれぞれ過学習対策を行ったモデルの学習、検証データを表しています。それぞれのモデルを比較した結果、過学習対策を行ったモデルの検証データの方がAccuracyが高く汎用的であることが分かります。また、Lossは減少しています。このグラフからベースモデルより過学習が改善されていることが確認できます。
|
1 |
model2.evaluate(test_padded, y_test) |

テストデータのAccuracyとLossについてもベースモデルより改善されていました。
モデルの評価
次は、モデルが正解ラベルを予測できた、またはできなかったテキストの数を確認したいと思います。
|
1 2 3 4 5 6 7 8 9 10 11 12 13 14 15 16 17 18 19 20 21 22 23 24 25 26 27 28 |
#混同行列 def pred_mat(test_padded, y_test, model): predict_prob=model.predict(test_padded) predict_classes=np.argmax(predict_prob,axis=1) y_pred = [] for score in predict_prob: if score < 0.5: y_pred.append(0) elif score > 0.5: y_pred.append(1) c_matrix = confusion_matrix(y_test, y_pred, labels=[0, 1])#混同行列のラベルの順序を指定 return y_pred, c_matrix #混同行列_DataFrame def make_cm(matrix, columns): n = len(columns) act = ["正解データ"] * n pred = ["予測結果"] * n cm = pd.DataFrame(matrix, columns=[pred, columns], index=[act, columns]) return cm y_pred2, c_matrix2 = pred_mat(test_padded, y_test, model2) cm = make_cm(c_matrix2, ["NEGATIVE", "POSITIVE"]) cm p = c_matrix2 / len(y_test) cm_p = make_cm(p, ["NEGATIVE", "POSITIVE"]) cm_p |

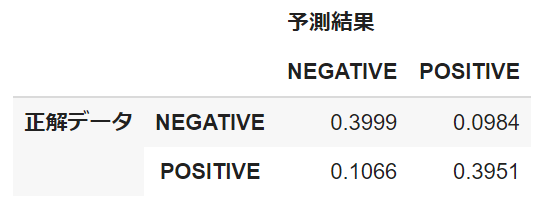
混同行列から正解ラベルに大きな偏りがないことが確認できます(ネガティブ:79728件、ポジティブ:80272件)。また、モデルが誤ってネガティブと予測したテキストは約10%、誤ってポジティブと予測したテキストは約9%であることからこれらについても大きな偏りがありません(以降では前者をFalse Negative Texts、後者をFalse Positive Textsと表記します)。これらのことからモデルはネガティブ、ポジティブ予測において同じくらい予測を間違えていることが分かります。
考察
ネガティブ、ポジティブ予測の間違いの傾向を探るためにFalse Positive TextsとFalse Negative Textsをサンプリングしていきます。
サンプリング
まずは、False Negative Textsをサンプリングします。
|
1 2 3 4 5 6 7 8 9 10 11 12 13 14 15 16 |
#False_Negative_Texts samp_index = [] index = 0 for label, pred in zip(y_test, y_pred2): if label == 1 and pred ==0: samp_index.append(index) index += 1 else: index +=1 #False_Negative_Texts_DataFrame x_test_numpy = np.array(x_test) x_test_samples = x_test_numpy[samp_index] sample_df = pd.DataFrame(x_test_samples, columns=["sample_text"]) sample_df.head(20) |

次に、False Positive Textsをサンプリングします。
|
1 2 3 4 5 6 7 8 9 10 11 12 13 14 15 16 |
#False_Positive_Texts samp_index2 = [] index2 = 0 for label, pred in zip(y_test, y_pred2): if label == 0 and pred ==1: samp_index2.append(index2) index2 += 1 else: index2 +=1 #False_Positive_Texts_DataFrame x_test_numpy2 = np.array(x_test) x_test_samples2 = x_test_numpy2[samp_index2] sample_df2 = pd.DataFrame(x_test_samples2, columns=["sample_text"]) sample_df2.head(20) |
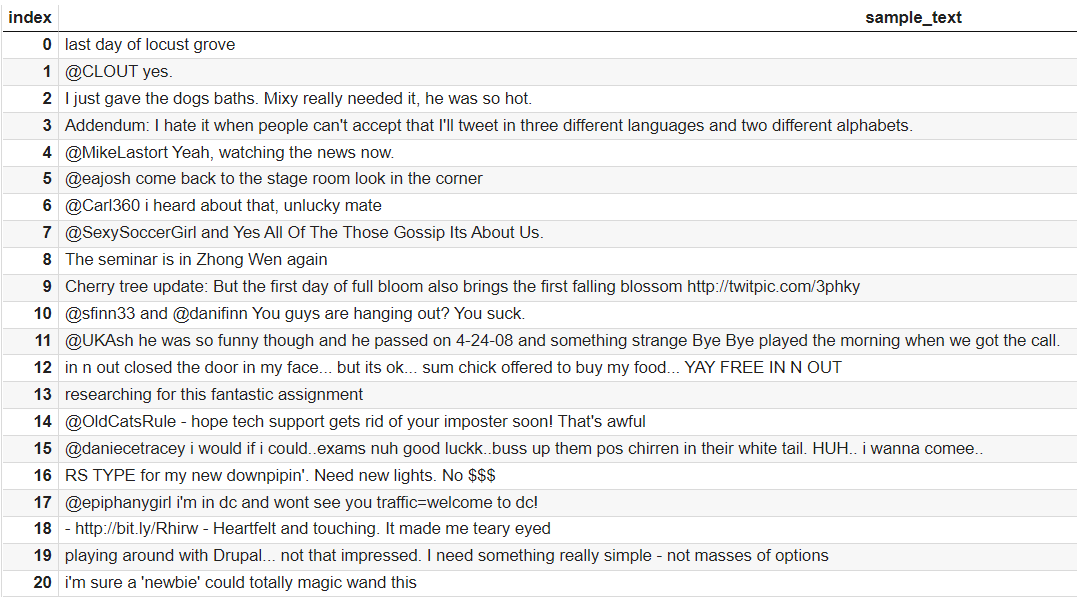
サンプリング結果を見ると記号(@、!、#)やURL、数字が多く含まれていることが分かります。これらのテキストの特徴を深掘りするために単語の出現頻度を求めて可視化します。まずは前処理を行います。
|
1 2 3 4 5 6 7 8 9 10 11 12 13 14 15 16 17 18 19 20 21 22 23 24 25 26 |
#False_Negative_Textsの単語を抽出 nltk.download("stopwords") def filter_stop_words(sentences, stop_words): for i, sentence in enumerate(sentences): new_sent = [word for word in sentence.split() if word not in stop_words] sentences[i] = " ".join(new_sent) return sentences #stop_wordの削除 stop_words = set(stopwords.words("english")) sw_x_test = filter_stop_words(x_test_samples, stop_words) #stemming snowball = SnowballStemmer(language="english") sw_x_test_texts = [text for text in sw_x_test] x_test_words = " ".join(sw_x_test_texts).split() clean_test_words = [snowball.stem(t) for t in x_test_words] #トークン化 nltk.download("punkt") w_list = [] for t in clean_test_words: t = nltk.word_tokenize(t) for w in t: w_list.append(w) |
|
1 2 3 4 5 6 7 8 9 10 11 12 13 14 15 16 17 18 19 20 21 22 |
#False_Positive_Textsの単語を抽出 def filter_stop_words(sentences, stop_words): for i, sentence in enumerate(sentences): new_sent = [word for word in sentence.split() if word not in stop_words] sentences[i] = " ".join(new_sent) return sentences #stop_wordの削除 stop_words2 = set(stopwords.words("english")) sw_x_test2 = filter_stop_words(x_test_samples2, stop_words2) #stemming snowball2 = SnowballStemmer(language="english") sw_x_test_texts2 = [text for text in sw_x_test2] x_test_words2 = " ".join(sw_x_test_texts2).split() clean_test_words2 = [snowball2.stem(t) for t in x_test_words2] #トークン化 w_list2 = [] for t in clean_test_words2: t = nltk.word_tokenize(t) for w in t: w_list2.append(w) |
次は、単語の出現頻度を可視化します。
|
1 2 3 4 5 6 7 8 |
c = collections.Counter(w_list) c2 = collections.Counter(w_list2) fig, (ax1, ax2) = plt.subplots(1, 2, figsize=(8, 8)) sns.countplot(y=w_list,order=[i[0] for i in c.most_common(20)], ax=ax1) sns.countplot(y=w_list2,order=[i[0] for i in c2.most_common(20)], ax=ax2) ax1.set_title("Pred_Negative", fontsize=20) ax2.set_title("Pred_Positive", fontsize=20) |
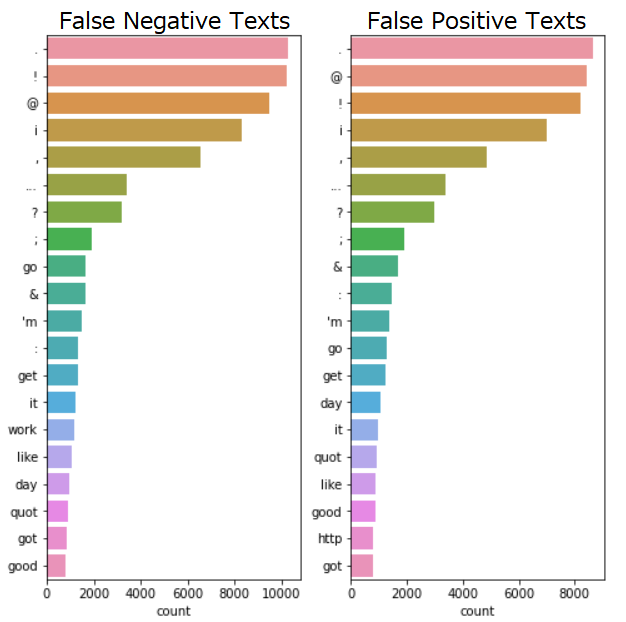
このグラフは、単語の出現頻度Top20を表しています。横軸が単語の出現頻度、縦軸が出現単語です。False Negative Texts、False Positive Textsともに記号が上位を占めていることや’m、quotという単語が頻出していることが確認できます。また、False Positive TextsにはURL(http)がTop20に含まれています。記号やURL、’m、quotがモデルの予測に何らかの影響を与えているのではないでしょうか。このことを調査するために記号、URL、’m、quotの有無で感情スコアを算出していきます。また、サンプリング時に数字も多く含まれている印象だったので数字の有無についても確認していきます。
感情スコア算出
モデルの予測結果から感情スコアを算出する関数を実装します。
|
1 2 3 4 5 6 7 8 9 10 11 12 13 14 15 16 17 18 19 20 21 22 |
POSITIVE = "POSITIVE" NEGATIVE = "NEGATIVE" NEUTRAL = "NEUTRAL" SENTIMENT_THRESHOLDS = (0.4, 0.7) def decode_sentiment(score, include_neutral=True): if include_neutral: label = NEUTRAL if score <= SENTIMENT_THRESHOLDS[0]: label = NEGATIVE elif score >= SENTIMENT_THRESHOLDS[1]: label = POSITIVE return label else: return NEGATIVE if score < 0.5 else POSITIVE def predict(text, model, include_neutral=True): x_test = pad_sequences(tokenizer.texts_to_sequences([text]), maxlen=max_length, padding=padding_type) score = model.predict([x_test]) label = decode_sentiment(score, include_neutral=include_neutral) results = f"label : {label}, score : {float(score):.2f}, text : {text}" return results |
実装した関数にテキストと学習したモデルを渡して記号、URL、’m、quot、数字の有無による感情スコアの変化を順に確認していきます。最後には、モデルが文脈を考慮した上でネガティブ、ポジティブを予測しているのかについても検証していきます。
記号の有無
|
1 2 3 4 |
#記号の有無(正解ラベル:ポジティブ) print(predict("@amandadoan you'll get the job", model2)) print(predict("amandadoan you'll get the job", model2)) print(predict("you'll get the job", model2)) |

False Positive TextsとFalse Negative Textsから3つずつ@(記号)を含んだテキストをサンプリングし、それぞれ@の有無で感情スコアを算出しました。上記は、算出したテキストの一例です。感情スコアは0に近づくほどネガティブ要素が強く、1に近づくほどポジティブ要素が強くなることを表しています。1行目は@ありのテキスト、2行目は@を削除したテキストです。また、返信用ツイート(リプライ)にはテキストの先頭に@と返信先ユーザー名が表示されるため@とユーザー名をセットで記号として扱い削除したものが3行目のテキストになります。ここでは、@の有無と@とユーザー名の有無についての検証結果と考察を述べます。
– @の有無
@の有無(2行目のテキスト)については、感情スコアに変化がありません。また、他の@(リプライ)を含んだテキストにおいて@の有無を確認したところ0%~1%の間でしか感情スコアが変化していませんでした。
– @とユーザー名の有無
@とユーザー名の有無(3行目のテキスト)については、感情スコアが70%も変化しています。他の@(リプライ)を含んだテキストにおいて@とユーザー名をセットで記号として扱い、これらの有無を確認したところ2%~4%の間でしか感情スコアが変化していませんでした。また、これらのテキストの特徴としてユーザー名がテキスト全体を占める割合は3割程度で、ここで紹介しているものより少ないことが分かりました。
これらのことから、@についてはモデルの予測にあまり影響を与えていないことが考えられます。しかし、@とユーザー名をセットで記号として扱った場合については、テキスト全体に対するユーザー名の長さによってモデルの予測への影響が変わってくるのではないでしょうか。
URLの有無
|
1 2 3 4 5 6 7 |
#①URLの有無(正解ラベル:ポジティブ) print(predict("i always dance alone in my room http://tumblr.com/xyx1xdji5", model2)) print(predict("i always dance alone in my room", model2)) #②URLの有無(正解ラベル:ネガティブ) print(predict("Cherry tree update: But the first day of full bloom also brings the first falling blossom http://twitpic.com/3phky", model2)) print(predict("Cherry tree update: But the first day of full bloom also brings the first falling blossom", model2)) |


記号の有無と同様に、False Positive TextsとFalse Negative Textsから3つずつURLを含んだテキストをサンプリングし、それぞれURLの有無で感情スコアを算出しました。上記では、2つのテキストの結果を示しています。両者ともに1行目はURLありのテキスト、2行目はURLを削除したテキストです。①のテキストは、感情スコアが1%しか変化していません。②のテキストについては17%感情スコアが変化しています。また、他のURLを含んだテキストについても0%~3%の間でしか感情スコアが変化していないことが分かりました。感情スコアは0~100%の値を取ります。それを考慮すると1%や17%は低い水準なので、テキストによって感情スコアが変化するものの大きな差はなくモデルの予測にあまり影響を与えていないことが考えられます。
‘mの有無
|
1 2 3 |
#'mの有無(正解ラベル:ポジティブ) print(predict("Oh man oh man. I found my old CD's. I'm listening to Underoath and Saosin's old schtuff", model2)) print(predict("Oh man oh man. I found my old CD's. I listening to Underoath and Saosin's old schtuff", model2)) |

1行目はもとのテキスト、2行目は’mを削除したテキストになります。’mの有無では5%しか感情スコアが変化していません。また、’mについて調べたところ’mはI’mを分割したものということが分かりました。正確には、単語の前処理(トークン化)のところでI’mがIと’mに分割されていました。’mの有無によって感情スコアがあまり変化しないことから、NP、PNにおける単語頻度Top20に’mが出現するのは、’mが全体のデータにおいても出現頻度が高いからではないかと考え、次に’mの頻度を調査しました。
– ‘mの出現頻度の偏り
上記混同行列のNN、NP、PN、PPそれぞれのテキストにおいて’mを含んだものの割合を求めた結果、順に8%、7%、8%、6%で大きな偏りがありませんでした。しかし、これらの割合だけからは’mが頻出単語であるとは言えないため最も頻出する単語の出現率と比較しました。
– ‘mが頻出単語といえるのか
最も頻出する単語の出現率については、順に55%、60%、50%、46%でした。この結果から’mは頻出単語とは言いにくそうです。
これらのことから’mは、NN、NP、PN、PPに関係なく出現し、モデルの予測に影響を与える単語ではないと考えられます。
quotの有無
|
1 2 3 |
#quotの有無(正解ラベル:ネガティブ) print(predict("I AM going to bed this time.. Apologies for the many "colourful" tweets, gona stick some Wilco or Grizzly Bear on to calm down..", model2)) print(predict("I AM going to bed this time.. Apologies for the many colourful tweets, gona stick some Wilco or Grizzly Bear on to calm down..", model2)) |

1行目はもとのテキスト、2行目はquotを削除したテキストになります。quotの有無では2%しか感情スコアが変化していません。quotについて調べたところ”(クォーテーション)を表す"というHTMLの特殊文字であることが分かりました。また、’mと同様に、混同行列のNN、NP、PN、PPそれぞれのテキストにおいてquotを含んだものの割合を求めました。結果は順に、1%、3%、2%、3%で大きな偏りがありませんでした。これらのことから、quotについても出現率にほとんど差がないことからモデルの予測にあまり影響を与えていないことが考えられます。
数字の有無
|
1 2 3 4 5 6 7 |
#①数字の有無(正解ラベル:ポジティブ) print(predict("will be moving on june 10.", model2)) print(predict("will be moving on june.", model2)) #②数字の有無(正解ラベル:ネガティブ) print(predict("I cannot wait til summer. 14 more days", model2)) print(predict("I cannot wait til summer. more days", model2)) |


False Positive TextsとFalse Negative Textsから3つずつ数字を含んだテキストをサンプリングし、それぞれ数字の有無で感情スコアを算出しました。上記では、2つのテキストの結果を示しています。両者ともに1行目は数字ありのテキスト、2行目は数字を削除したテキストです。①のテキストは、数字の有無によって感情スコアが1%しか変化していません。②のテキストについては感情スコアが10%変化しています。また、他の数字を含んだテキストについては0%~17%の間で感情スコアが変化していました。感情スコアは0~100%の値を取ります。それを考慮すると1%や10%、または17%は低い水準なので、テキストによって感情スコアが変化するものの大きな差はなくモデルの予測にあまり影響を与えていないことが考えられます。
文脈を考慮した予測かどうか
|
1 2 3 |
#文脈の確認(正解ラベル:ポジティブ) print(predict("cannot wait for my date tonight... and this weekend. I so bad", model2)) print(predict("cannot wait for my date tonight... and this weekend. I so", model2)) |

モデルが文脈を考慮して予測しているのかを検証するためにFalse Negative Textsの中からネガティブ要素を持つ英単語badを含むものをサンプリングしました。ここでは、強い願望を表すso badという表現の中でbadが用いられているテキストを使用します。1行目はもとのテキスト、2行目はもとのテキストからbadを削除したテキストです。翻訳すると、「今夜のデートが待ち遠しい…今週末も。デートがしたくて仕方ない」という意味になるのでテキストにはネガティブ要素が含まれていません。しかし、1行目の結果からモデルはネガティブと予測しています。また、badを削除しただけで74%も感情スコアが上昇し、モデルはポジティブと予測していることが確認できます。これらの結果からモデルはネガティブ要素を持つbadに引っ張られてテキストの感情を正確に予測できていないことが考えられます。つまり、文脈を考慮した予測ができていないということです。
おわりに
以上がTwitterにおける感情分析でした。TensorFlowを用いてテキストから感情を推測するモデルを構築することができました。今後の課題は以下のとおりです。
- 前処理の見直しを行う。(文字化けした文字の除去、@とユーザー名をセットで除去など)
- 文脈を考慮した学習を行う。(RNN、LSTMレイヤの追加など)
- 過学習対策の見直しを行う。(ニューロン数の削減、Dropoutレイヤを追加する位置など)
Go, A., Bhayani, R. and Huang, L., 2009. Twitter sentiment classification using distant supervision. CS224N Project Report, Stanford, 1(2009), p.12.
K.Y


